I’ve just confirmed that me and my box of sea-level stripes will be making our way to Scarborough this Saturday (27th May) to be part of a fabulous panel exploring ways in which the sea speaks to us – as artists, as scientists, as fishing communities, as policy-makers. It’s great to have an excuse to dust my knitting needles off and talk about using scientific data in ways that illuminates and makes sense of people’s worlds – and of talk about material culture and hands-on practice as a way of doing impactful research. We’ve learnt so much about designing and delivering this kind of work as part of the Risky Cities project in Hull, but all of the community engagement, arts development, evaluation and monitoring that has gone on has left my sea-level stripes lingering on the bookshelf for over a year – so a trip to the sea-side (and hopefully a few more rows knitted as well) is well deserved. Will post pics next week if
It’s been a long time coming, but the Sea Level Stripes are finally out of the office, making an appearance at Hull University Union’s Climate Café for Earth Day 2022.
Discussions ranged around the ethics of energy transformation, what universities could do better, whether the National Student Survey could/should about sustainability (answer: YES) and the importance of small changes implemented on a huge scale.
Confession: most of the handwork I do is an excuse to play with colour. I might have limited drawing skills, but my love for colour whether it comes as ink, fabric or yarn, is endless. One of my favourite hidden benefits of landing in a Geoscience institute is that the visual world of geoscience is surprisingly colourful. Yes, my colleagues may spend lots of time measuring how sticky mud is, or how ripples form on the muddy sea-shore. But they turn their data into the most glorious multi-coloured visualisations. Who knew bathymetry* came in rainbow colours?
Whilst these visualisations of depth or intensity may look good, their representation in a rainbow spectrum doesn’t work for everybody. In fact, Prof Ed Hawkins who devised the original climate stripes, wrote this excellent blog piece on the need for finding ways to #endtherainbow. In his 2016 EGU paper he notes that scales need to be culturally appropriate as well as visually accessible. That’s pretty straightforward for mapping heat where we’re used to understanding blue/cold, red/hot, but what’s a culturally acceptable scale to express sea-level?
My initial experiments using modified Excel heatmaps weren’t great- the annual figures needed to be clustered together or I’d have needed dozens of different colours of yarn. Buying unreasonable quantities of yarn is not usually a barrier for me, but I was spending NERC’s money so I tried to simplify things. By clustering the numbers into bands, I was able to create a more manageable scale that could be replicated with 8 yarn colours. And that meant the fun part could really start: choosing the yarn…
As a social scientist the prospect of taking a deep dive into the vastness that is the British Oceanographic Data Centre was slightly intimidating. I’m used to ethnographic, qualitative data that feeds me with rich themes and storied patterns after months of close-reading and coding. Put me in front of a screen of numbers and I tend to get a little nervous. But if this project was going to work, and I was going to handcraft me some sea-level stripes then I’d need some data to base my work on.
So in I jumped. Despite my cautiousness, the BODC resources were easy to navigate and understand. I found my sea-level data for the nearest observation station, at Immingham on the southern bank of the Humber.
The data available from Immingham went back sufficiently far to give me a nice juicy dataset of 50+ years of sea-level measurement (technically these are sea surface elevation measurements from the UK tide gauge network). Taking advantage of a couple of days working from home (when that was a treat rather than a necessity), I downloaded the data and calculated the mean sea level for each year that the data included.
At this point, I should note that whilst I hoped very much that I’d find a pattern showing ever-rising sea level, I didn’t actually know whether I’d have a) enough data or b) the right kind of data to show this. Once I’d worked out a series of annual mean measurement figures, I heat-mapped the results using a standard red-green scale and found…
a steadily rising tide. Sure, there were ups and downs in what looked like a cyclical pattern of 9-10 years but there was a definite and undeniable trend towards higher sea level. I had my data.
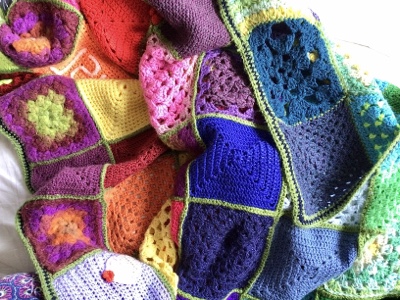
That is a good question. It was so very nearly crochet, knitting’s slightly kookier, hyperbolic cousin. If I was making or coordinating a collaborative piece, I would usually suggest crochet. In fact, on most of the community blankets I’ve worked on or coordinated, crochet is the default method. Firstly, this is because crocheted textiles tend to be slightly more rigid than knitted, so there is less difference between the stretchiness of squares made by different hands. Knitted squares can have a huge disparity in stretch, which can make the finished article look pretty lumpy when everything is stitched together. Secondly, crochet makes nice crisp textures, and in experienced hands its hyperbolic possibilities can become truly sculptural. Thirdly, I find crochet to be faster than knitting, especially when making a pattern that is 50% holes (on purpose, obvs). So crochet is by default technique for making blankets and other household textiles.
But at heart I am a knitter. I’ve knitted avidly for 20+ years and have taught many others to knit in that time. By contrast, I’ve only been crocheting for 7 years, after a nasty right-hand fracture left me unable to hold a knitting needle. I’d tried to crochet several times before, always giving up in a frustrated tangle of twisty, messy knots. With one hand down, I had no other outlet for my need to knit so I persisted and eventually became a competent-enough crocheter. I haven’t ever managed to teach anyone else to crochet though, and often struggle to explain the structural process to myself when I get stuck on a pattern. So it wasn’t the ideal choice for any kind of performance craft.
Also, several attempts to crochet nice neat single colour stripes just didn’t work- I ended with wonky strands that couldn’t have been worked into a single textile.
So much as I love the crisp clarity of crochet, I went with knitting for this project. I am pretty confident that I can teach anyone to knit a 6-stitch strip of plain knitted textile, and these ribbons will be easier to fit into a finished piece than wobbly crochet strands.
That said, before I can really get started, I have an urgent repair to do on one of my community blankets, made for a dear friend who was undergoing chemo. He’s passed away very recently, and I’m trying to get the repair done and back to his family before his funeral. These things we make with hands, head and heart can be so very comforting when words are not enough.
The #climatestripes developed by Prof Ed Hawkin at Reading University are Great Leap Forward for the communication of climate science. They provide such an easily interpreted visualisation of temperature data sets, and I love them. And if I learnt one thing from my years as a craft teacher, it’s to #CASE (copy and share everything) work that I love, both honouring the original creator and responding to their creation in my own way.
The open access climate stripes tool hosted by Reading’s Institute for Environmental Analytics is a great way to generate temperature data visualisation on a country-by-country. But my hunch is that more localised environmental data might be more meaningful. The project that I’m a Researcher in, the Flood Innovation Centre, is based at the University of Hull, and for good reason. Yes, part of our project’s remit is to energise the flood resilience market for SMEs in our area, but a big part of it is also raising awareness that we need to start thinking *now* about the impacts that climate change is going to have. There’s a lot of denial in the UK about the reality of these impacts, in part because the traditional narratives of climate change impacts generally feature things happening a long way from where we are- not many people see starving polar bears on a daily basis, for example, struggling to find food without sea ice to hunt on.
Making climate change locally meaningful is tricky in this place. We have a pretty benign climate, and live in already-developed landscapes for the most part. The changes that are already happening tend to be relatively subtle, and spread out over time and space. This makes them harder to read. There’s no denying a massive wildfire, but we’ve always had lots of rain in winter so it’s easy to deny any connection between climate change and more extreme weather patterns.
One of the big hazards faced along the whole of the UK’s east coast comes from rising sea levels, prediction of which are pretty harrowing. The city of Hull is extremely low lying, with a great deal of industrial infrastructure positioned along the unreliable Humber shoreline.
All of this led me to consider using sea-level data for my visualisation: could I turn sea-level measurements from the Humber into a pattern which could/should/might possibly show gradually rising sea-levels?
It’s been a long time coming, but the Knitting Sea Level Stripes project is finally emerging into the world. And it’s emerging into a world that is very different from the one it was planned for. Since my successful bid to join the Earth Arcade Academy I’ve spent most of my time trying to work out how to do participatory handwork in the COVID-19 shaped world.
The main research tool I had planned to use was the enormous yet mysterious, controversial practice of knitting-in-public. Seasoned knitters will doubtless share my experience of sitting down quietly to read and knit in a café or train carriage, only to be regularly engaged in happy chit chat about what exactly is on my needles. It has often seemed as though the act of creating in public removes many of the barriers to nosiness that we normally throw around us.
Based on this experience, I wondered what would happen if the thing I were to be knitting in public was potentially controversial. As an interdisciplinary researcher straddling cultural anthropology, climate science and socio-hydrology, I wondered what would happen if I used some of the (frankly alarming) data that I come across in my research. Completely indebted to Ed Hawkins of Climate Stripes fame, I wondered if I could turn a different environmental dataset into a colour coded striped pattern. If I could come up with something local (I’m based at the Flood Innovation Centre, part of the Energy and Environment Institute at the University of Hull) then, what kind of conversations would that lead to?
There are, however, no science fairs, on-campus open days or knitting festivals where I can pitch up and knit, waiting for conversations to happen. For all the marvellous accordances of online conferencing, virtual meetings lack the key element of informal happening-across which was fundamental to my research design. Our interactions online are necessarily purposive and deliberate: we cannot wander a room and browse.
But I think I might have found a couple of ways to make the project work. It certainly won’t have the spontaneity of my original plan, but it does mean that the ideas behind the project get out into the world. And it gives me a reason to dig out all the lovely (plastic-free, obvs) yarn that was carefully packed away when lockdown started. That in itself is a reason to take up my needles and knit.